Instead of constructing a new project from scratch, let us reuse the project from another module.
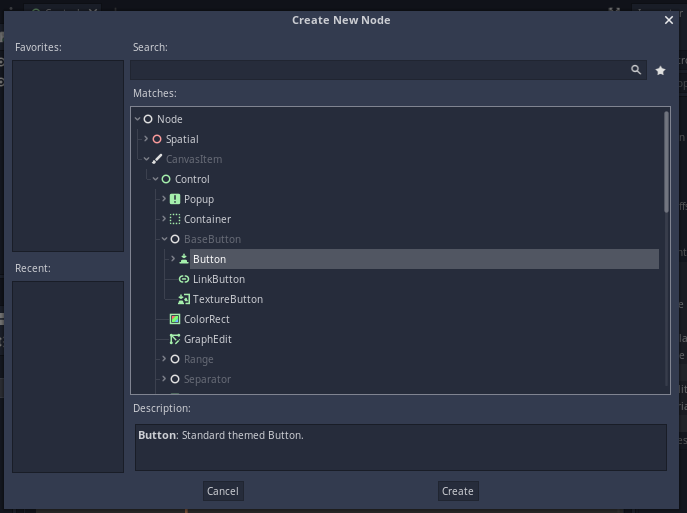
In the Scene dock, click (and therefore select) the root node named “Control”. Then click the + button to add a button. A button node type is under the “Control | BaseButton” category.
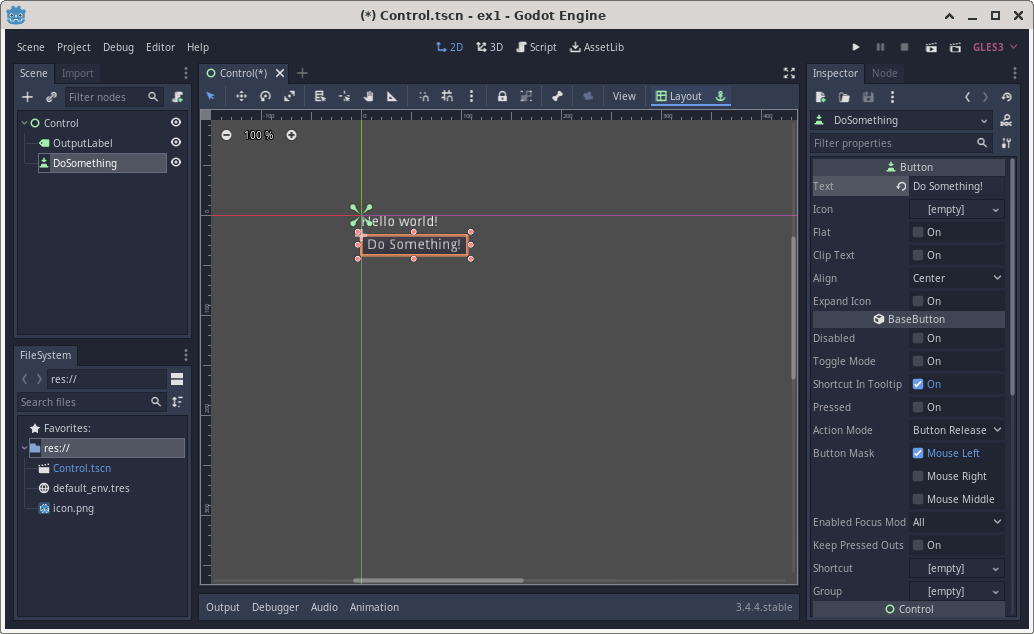
Select the “Button” node type, and then click “Create”. This adds a Button member to the root node. Right click the Button node in the Scene dock and rename it to “DoSomething”.
You may also want to change the Text property of this newly added Button to a matching “Do something!”. The button should be moved because the default position overlaps with the Hello world! label from the previous project.
When you are finished with these steps, the editor should look similar to the following screen shot:
You can run this project, but the button is not going to perform any actions because there is no code associated with the click event of the button.
The Inspector dock is also the Node dock (different tabs of the same dock). First, in the canvas dock, select (click) the button, then select (click) the Node tab of the Inspector/Node dock. The GoDot editor should look similar to the following screen shot.
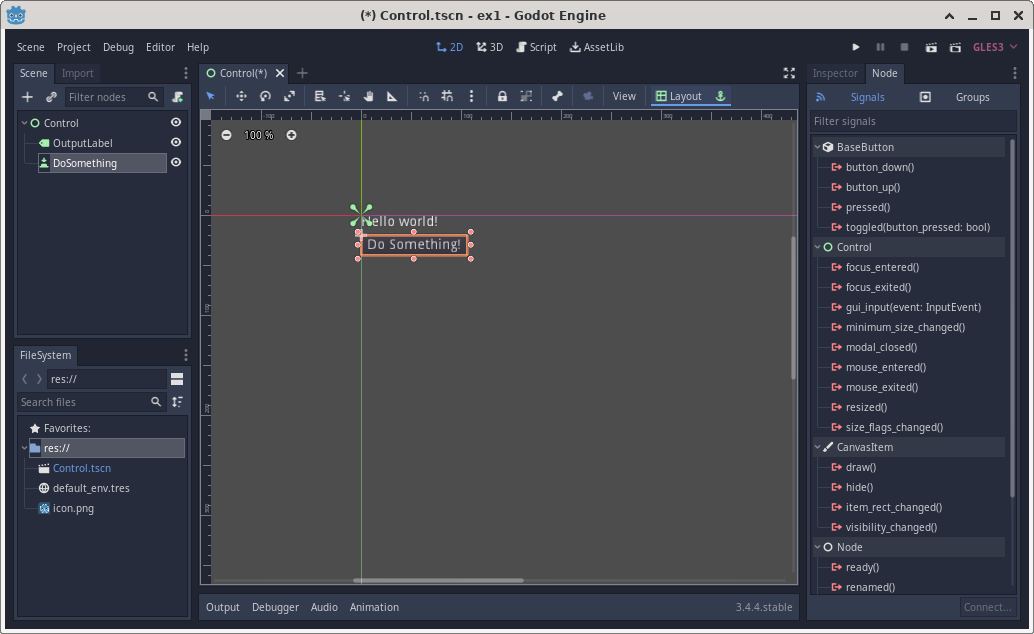
The “Signals” sub-tab is automatically selected. You can see that pressed() is one of the signals that a BaseButton node can respond to.
What is a signal?
A signal is a type of asynchronous event. “Asynchronous” in this context means the timing of an event cannot be predicted or controlled by the app. For example, when a user decides to click a button is asynchronous.
When a signal/event happens, code called a “handler” can specify what to do.
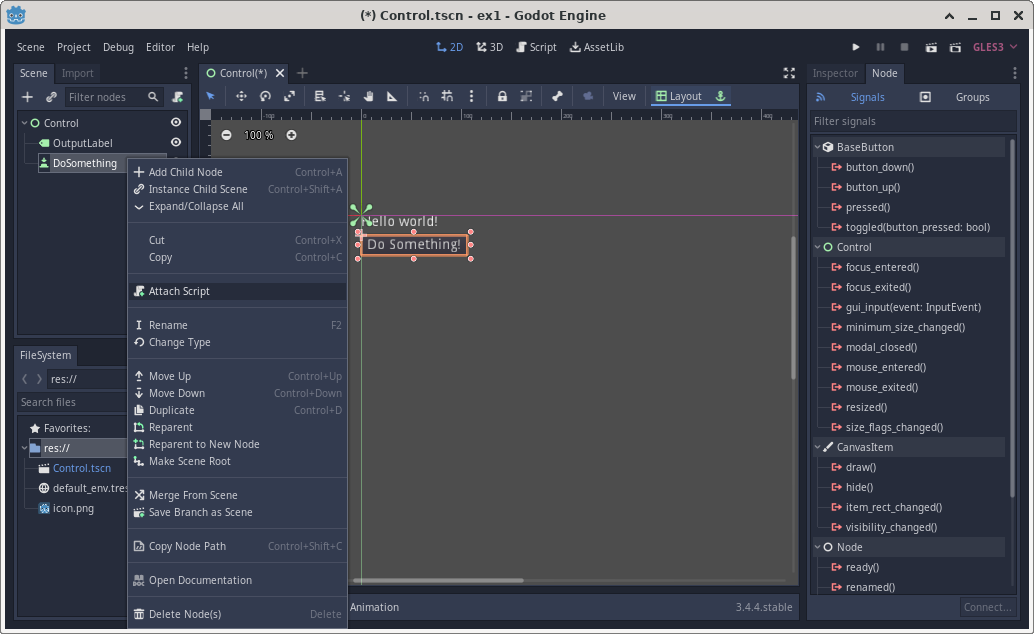
In order to write code (in response to the “pressed” signal), it is necessary to attach script to the node. To do this, right click on the button node (it should be renamed to DoSomething), then select “Attach Script” as shown below:
GoDot then uses a dialog box to ask a few questions as follows:
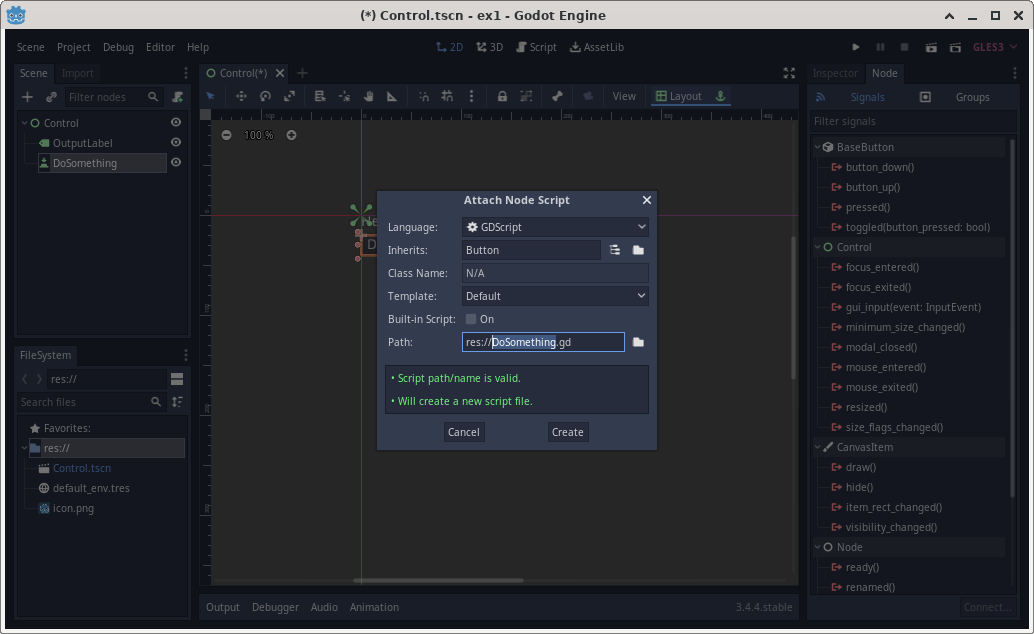
You can accept all the default values and click Create.
What is node script?
If you are already familiar with OOP, the script attached to a node is a class definition. The class being defined is a sub-class of the type of the node.
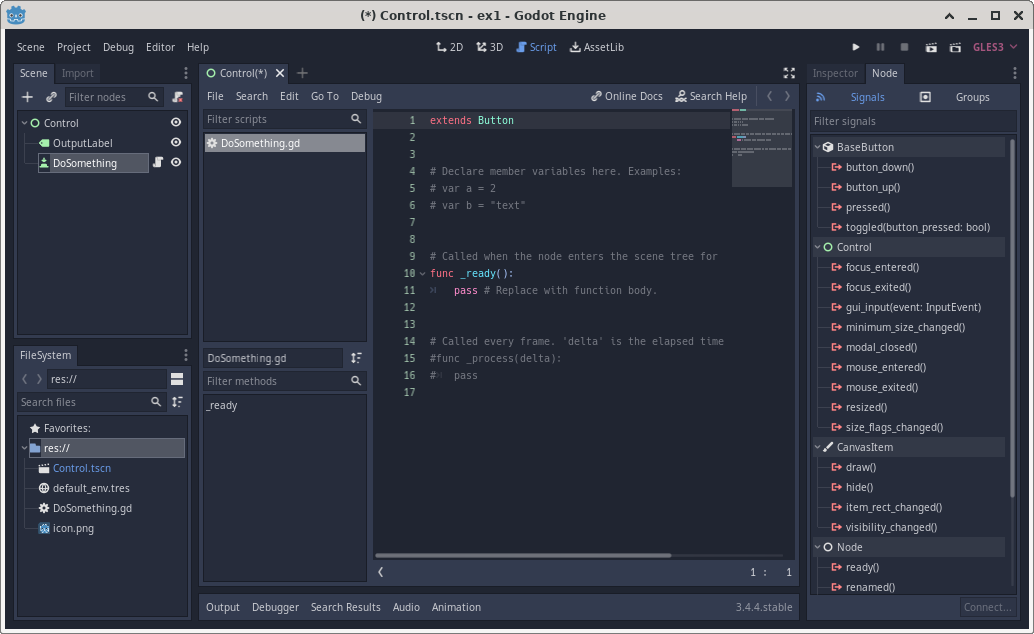
At this point, the editor should look like the following:
Now right-click pressed in the Inspector/Node dock, then click connect. The editor should look like the following screen shot.
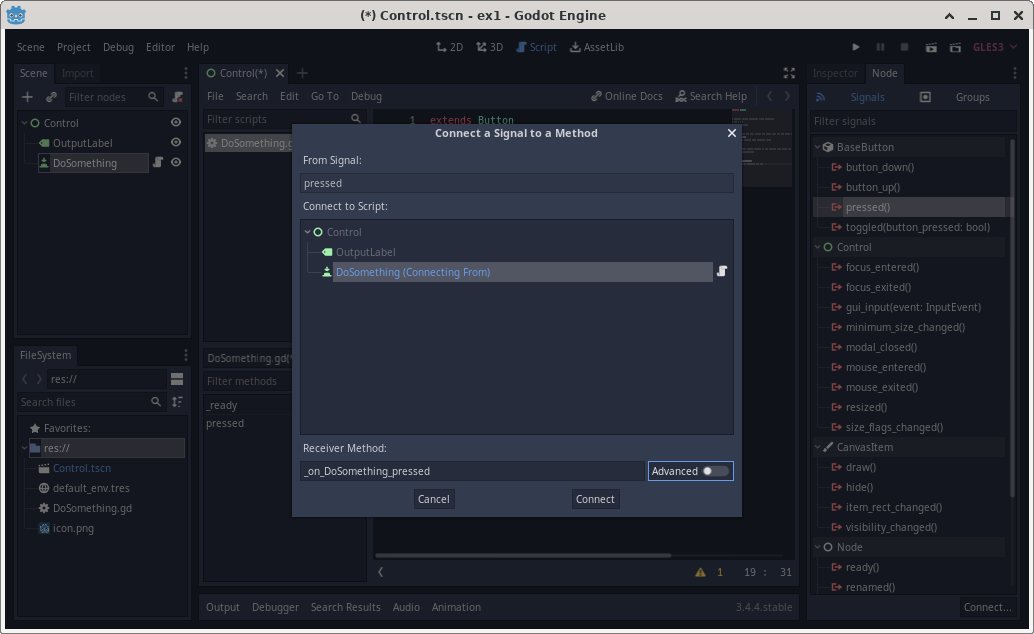
Click Connect and the skeletal code of the pressed signal handler is automatically inserted as method _on_DoSomething_pressed(). By default, the function has a single pass statement. pass specifies to do nothing. That is fine for now.
Now is a good time to save the scene and test run the app. Click the button, and nothing should happen!
What is the whole point of this exercise when there is nothing happening? This is a good opportunity to introduce the debugger!
A debugger is a utility component or program that helps a developer debug a program. To debug a program is to find out why it is not working correctly. You are correct that the app cannot possibly have any bug (defect) at this point because it has no code!
Nonetheless, we can start to experiment with debugging! We start with placing a breakpoint in the program. A breakpoint specifies a point in the code where execution will be paused when this point is reached. We will add a breakpoint on the pass line of _on_DoSomething_pressed. This is easily done by clicking the left empty space of the line. A breakpoint is toggled, meaning that the same method removes an existing breakpoint.
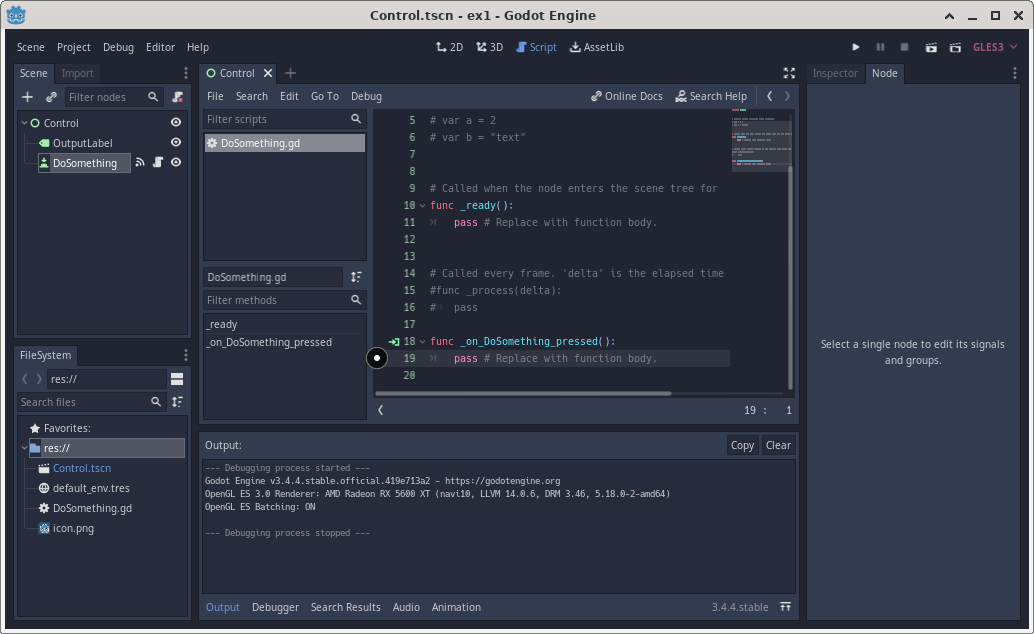
Once a breakpoint is added, you should see a red rectangle (like the “stop” button on a cassette tape player) to the left of the line.
Run the app again and click the button. The execution now pauses on the pass line of _on_DoSomething_pressed. The editor should look like the following screen shot.
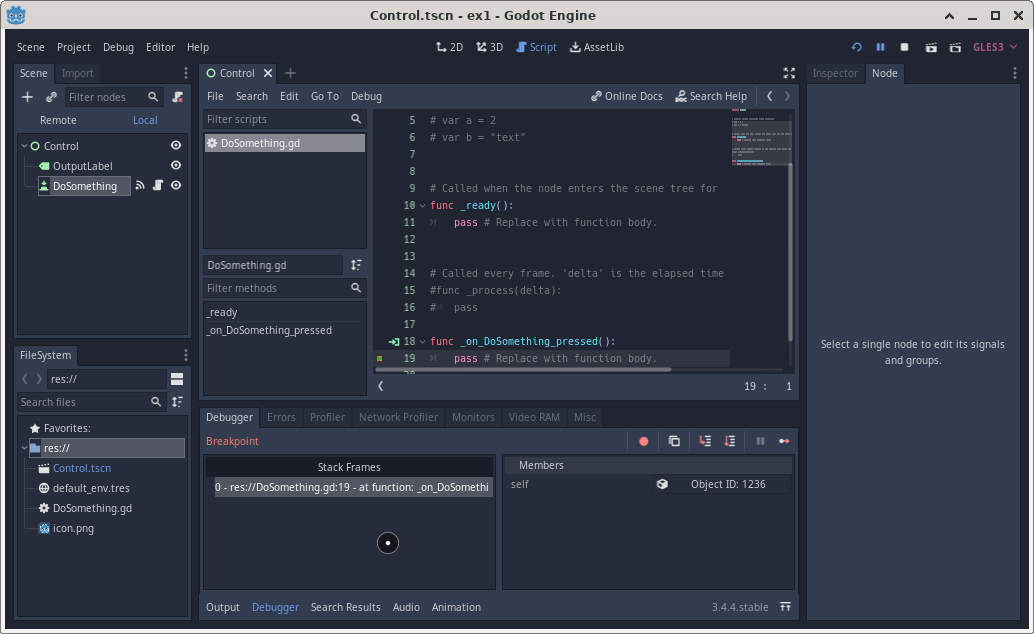
There is not much to see at this point. You can let the app continue execution using the continue button on top of the debugger panel (hover the mouse over the buttons to find out which one is the “Continue” button).
Even as is, the debugger can validate whether the execution of an app gets to a certain point of the code. In this case, we can verify that the signal handler _on_DoSomething_pressed executes when the corresponding button is pressed.
Expression evaluation when paused in the debugger
If you have used debuggers like gdb or the debugger component of VSCode, you will find the debugger of GoDot 3 quite limiting because you cannot evaluate any arbitrary expression. The ability to evaluate an arbitrary expression while paused in the debugger is in the works, but there is no telling when it will be available as of summer 2022.
You can sprinkle print statements in an app. The output of print statements are presented in the “Output” panel. However, this method is quite limiting because you cannot change the print statements while an app is in execution.
This project can be downloaded.