Replit is a web-based environment to
develop programs in a variety of programming languages. The C
programming environment is actually quite flexible. We will investigate
how to use gdb in this environment.
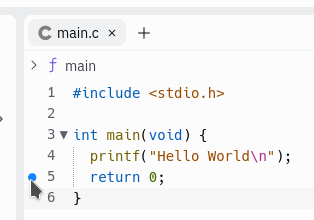
First, load a C or C++ project. A debug session will not start unless you place at least one break point in the source code. This is done by clicking the space immediately to the left of a line number.
Next, start the debug session.
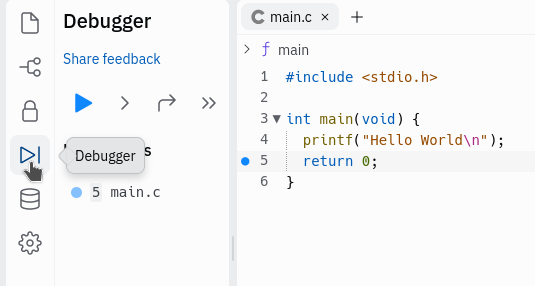
Once a debug session is started, click the “play” button. This triggers Replit to compile the source code to an executable that has all the debug symbols.

The executable should be present now. Go to the Console
and type ls, then the ENTER key. You should see
main-debug as a file. This is the executable with debug
symbol information.
At this point, you can use the shell or
console tab to run gdb using the following
command:
gdb main-debugThe last line should read “Reading symbols from main-debug…”, and the
prompt in gdb should be (gdb).
At this point, you can use all the gdb commands.